CH-01 · Fundamentals
Spectral analysis basics
Before any repair or tone change, an engineer needs to see the spectrum honestly. This article covers the transform that produces that view, the meaning of its bins, the consequence of windowing, and the artefacts that appear when a reader trusts a display without understanding it.
From waveform to bin
A discrete transform takes a short block of samples and reports how much energy sits at each of a set of evenly spaced frequencies. That block is the frame, its length in samples is the transform size, and the frequency spacing between adjacent reports is the bin width. For a frame of N samples at a sample rate F, the bin width is simply F divided by N. A frame of 4096 samples at 48 kHz therefore gives a spacing near 11.7 Hz between bins, while 1024 samples at the same rate gives roughly 47 Hz.
The trade is unavoidable and worth stating plainly: a longer frame resolves close frequencies but smears them in time, and a shorter frame tracks fast events but blurs their pitch. A transient click lives for a few milliseconds and needs a short frame to be located; a steady hum sits at fixed frequencies and is best seen with a long frame. Competent analysis means choosing the frame for the question being asked rather than leaving one value in place for the whole session.
Tapers and leakage
The transform assumes that the block repeats forever. Nothing in a real recording satisfies that assumption, so the frame is multiplied by a taper before analysis. Without a taper the first and last samples disagree, a discontinuity is created at the seam, and energy from every tone leaks into neighbouring bins. That smearing is spectral leakage, and it is a property of the analysis window, not of the recording.
Taper choice sets a balance between the width of the main lobe, which controls how well two nearby tones separate, and the height of the side lobes, which controls how far a loud tone contaminates quiet neighbours. A rectangular taper is the narrowest but leaks badly. A Hann taper is the common default for general viewing. A Blackman-Harris taper suppresses side lobes further at the expense of a wider main lobe, which suits the search for faint tones beside loud ones.
| Taper | Main lobe (bins) | Side lobes (dB) | Preferred use |
|---|---|---|---|
| Rectangular | 2.0 | -13 | transient capture, short frames |
| Hann | 4.0 | -31 | general spectral view |
| Hamming | 4.0 | -43 | speech, narrow-band work |
| Blackman-Harris | 8.0 | -92 | faint tones beside loud ones |
Reading a spectrogram
A spectrogram stacks successive frames side by side. Time runs along one axis, frequency along the other, and colour or brightness stands for magnitude. It is a compact and honest view of a whole recording, but it hides two facts: the transform has no phase information in the display, and the resolution is fixed by the frame used to build it. Vertical streaks mark broadband events such as clicks and impacts. Horizontal bands mark steady tones, hum and whistle. A soft haze between them is the noise floor, and its shape tells an engineer more about a room than any single measurement.
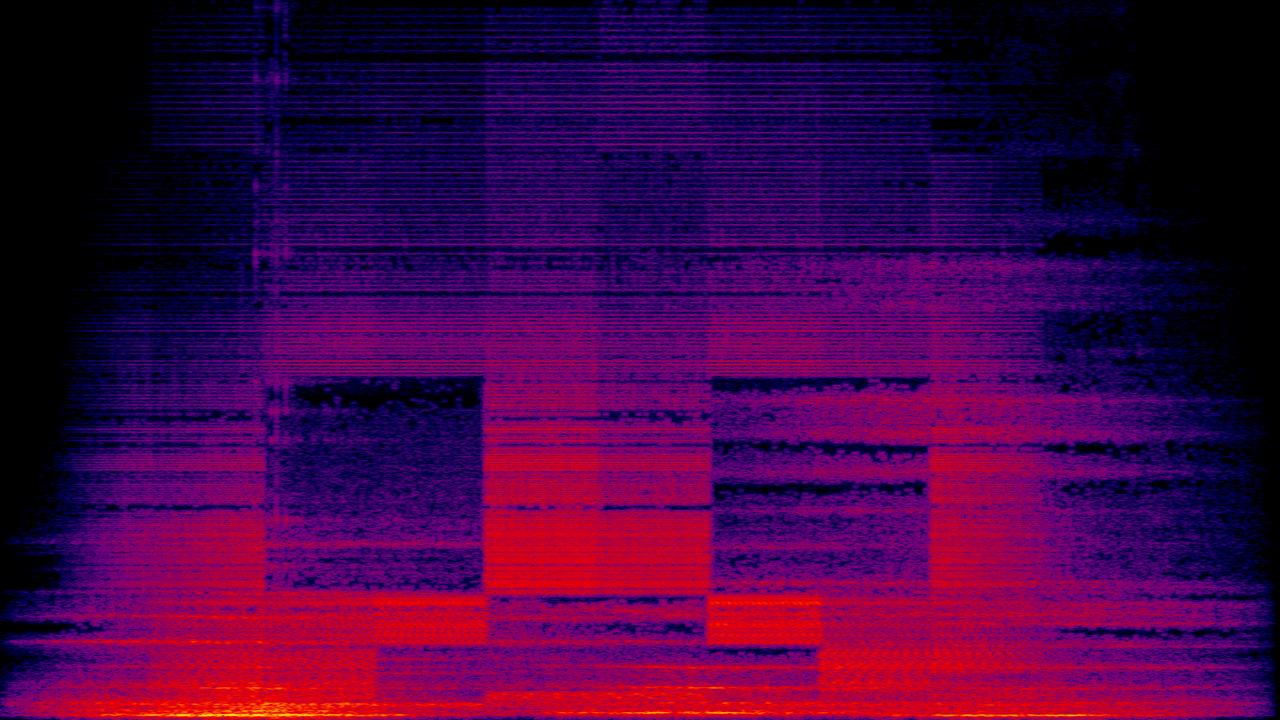
Two display traps deserve a warning. The first is a colour map that exaggerates contrast, making a normal noise floor look catastrophic. The second is a linear frequency axis, which is correct but compresses the band where most musical energy lives; a logarithmic axis spreads the low band and shows structure that a linear view buries. Neither map is wrong, but a reader must know which one is on screen.
Practical rule: set the frame from the question. If you are looking for a click, shorten it. If you are measuring a hum, lengthen it. Then leave the setting alone long enough to compare two recordings fairly.